black and brown leather padded tub sofa

Wir automatisieren Ihr Reporting, damit Sie weniger Zeit mit Tabellen verbringen und mehr Zeit für das Wesentliche haben – präzise Analysen, klare KPIs und bessere Geschäftsentscheidungen.

Warum myDataFlow?

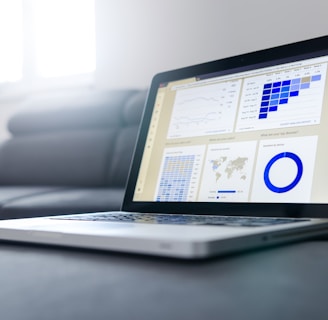
Optimierte Dataneanalyse

Schnelle und präzise Berichterstattung für Ihr Team. Smart und flexibel dank Google Sheets und Excel.

A laptop with an open screen displaying dashboard analytics featuring charts, graphs, and numerical data related to sales and subscriptions. The interface is predominantly dark-themed with sections highlighting key performance metrics. The device shown is a MacBook Pro, indicated by the keyboard layout and branding.
Automatisierte Berichte

Individuelle Lösungen für sämtliche Reporting-Bedürfnisse.

Modern, übersichtlich, verständlich - für bessere Entscheidungen in Ihrem Unternehmen.

KPIs im Fokus
An abstract, pastel-colored, 3D-rendered representation of data analysis and search engine optimization (SEO). The image features a computer interface with various analytics symbols, including a magnifying glass, bar charts, pie charts, and a search bar with the text 'SEO'. Surrounding the interface are different objects such as a potted plant, a cup with a saucer, and a megaphone, all placed on a light green background.
A person is viewing a map with red data points on a computer monitor, likely indicating a geographical distribution. The image has a focus on technology and data analysis.

myDataFlow ist die Lösung für Sie, wenn Sie:

❌ Regelmäßig Daten manuell in Excel oder Google Sheets eingeben
❌ Jeden Monat dieselben Berechnungen händisch durchführen
❌ „Tote Tabellen“ haben, die mehr Chaos als Klarheit bringen
❌ Immer wieder dieselben Formeln kopieren & anpassen müssen
❌ Daten aus mehreren Tabellenblättern mühsam zusammenführen
❌ Ständig überlegen müssen, ob Ihre Zahlen aktuell & korrekt sind
❌ Wichtige Kennzahlen nicht auf einen Blick erfassen können

silver iMac and Magic Keyboard on ta ble near white printer paper
black and brown chairs and tables

Von Daten zu Entscheidungen und mit automatisierten Reports zu mehr Übersicht

Hier finden Sie unsere ersten Projektbeispiele, die zeigen, wie automatisierte Reports Unternehmen dabei helfen, Daten effizient zu nutzen, um bessere Entscheidungen zu treffen und einmal eingerichtete Reporting-Systeme eine strukturierte Übersicht liefern.

person in blue shirt writing on white paper
white and black hospital bedwhite and black hospital bed
turned on black and grey laptop computerturned on black and grey laptop computer